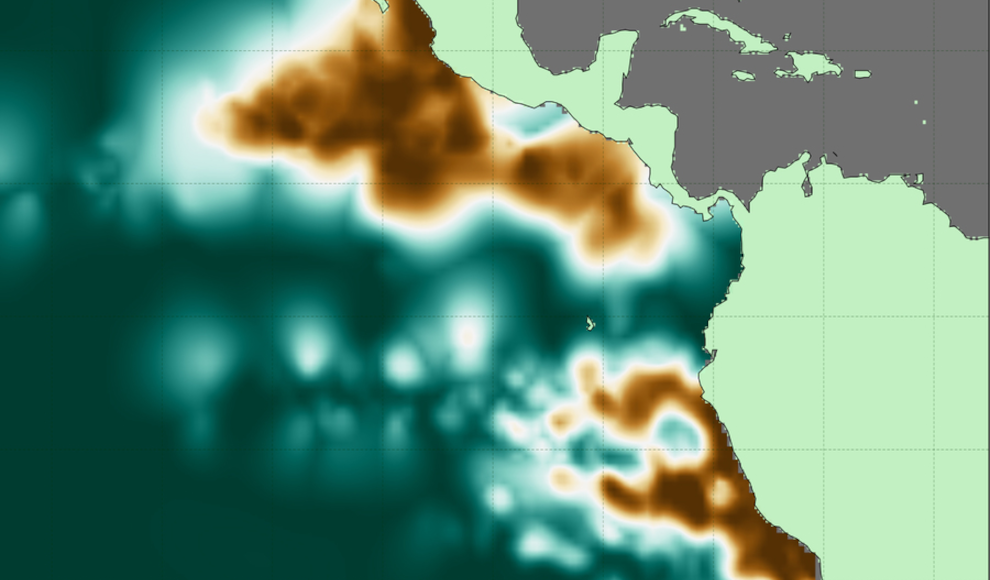
The impact of climate change on the world’s oceans has led to the creation of “dead zones” where oxygen levels are so low that marine life cannot survive. However, until now, these zones have only been roughly mapped. Researchers from the Massachusetts Institute of Technology (MIT) have now created the first detailed three-dimensional maps of the two largest oxygen minimum zones on Earth. These zones are located in the eastern Pacific Ocean and cover an area of 600,000 and 1,800,000 cubic kilometers respectively. The maps were created using data from 15 million measurements taken over the past 40 years by research ships and buoys.
Climate change has caused the stratification of seawater in many parts of the oceans, which hinders gas exchange and leads to a shortage of oxygen in the deep and middle layers of water. This creates dead zones where marine life cannot survive. The new maps provide a detailed understanding of the depth, extent, and internal structure of these zones. They will serve as a reference for future measurements and help to identify the causes of dead zones in some areas and not in others.
The researchers hope that the data collected will help to better understand how the ocean’s oxygen supply is controlled. They also predict that the dead zones will continue to grow as the Pacific Ocean warms. The maps will provide a benchmark for future research and help to track changes in these zones over time. The study highlights the importance of detailed mapping of dead zones to provide a better understanding of the impact of climate change on the world’s oceans.